The Statistics Window
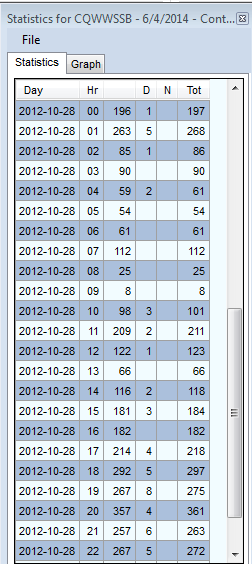
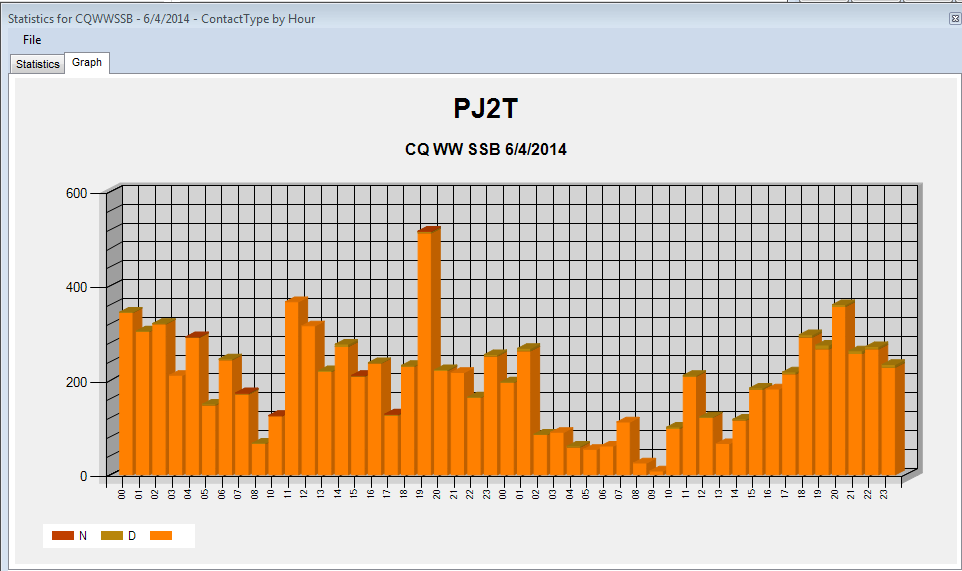
The Statistics window can be found under View > Statistics in the Entry Window. New in N1MM Logger+ is provision of graphical as well as tabular presentation of data. Select either by clicking the tabs at the top of the screen.

Or you can present the same data in graphical form. Be forewarned, this is not a PJ2T log – that call is just an example.

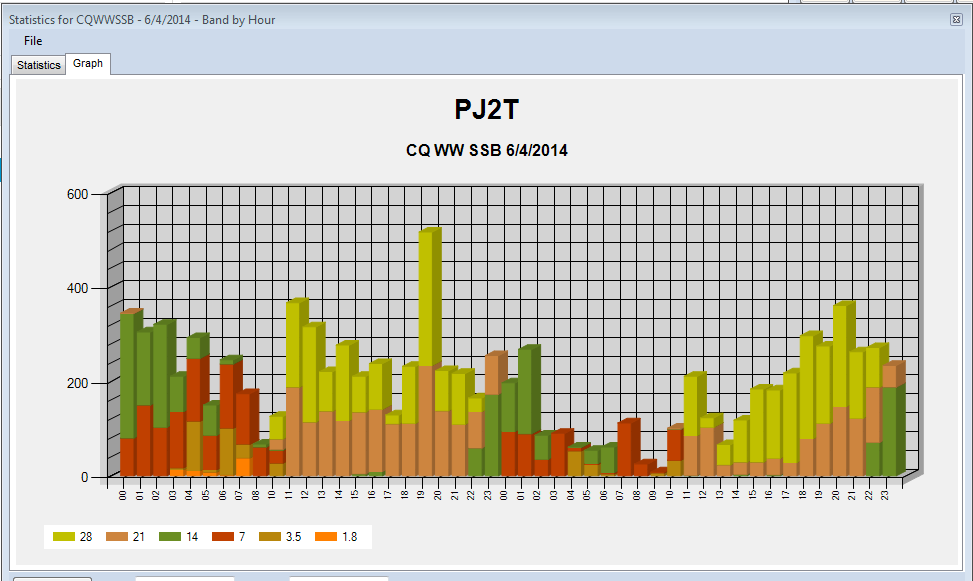
The graphical representation really comes into its own when the data are more complex. For example, if you want to know at a glance which bands were most productive when, graph hours versus bands.

During a contest, if you are checking Statistics and a station comes back, just start typing. The statistics window will go to the background and every typed character will go to the Entry window.
General
The Statistics window allows you to select almost all database fields from a contest for display in tabular form by row and column, or in graphical form. The following table explores the options and their usefulness in various contexts.
| Fields | Row | Column | Remarks |
| Band | Y | Y | – |
| Operator | Y | Y | compare operators. Only useful when running Multi-operator |
| Hour | Y | N | – |
| RadioNr | Y | Y | only useful when using more than one radio |
| Mode | Y | Y | useful in mixed contests |
| CountryPrefix | Y | N | worked number of stations per country or mode |
| Zone | Y | Y | – |
| Section | Y | Y | used in many domestic or local contests – may equate to province, oblast, ARRL section, etc., depending on the contest |
| CK | Y | N | 2 digit number used in Sweepstakes, formally denoting the year first licensed |
| Prec | Y | Y | Precedence used in Sweepstakes to denote class of entry |
| Points | Y | Y | – |
| Mult1 | Y | Y | multiplier, or first multiplier in contests with more than one |
| Mult2 | Y | Y | Second multiplier in contests with more than one |
| Mult3 | Y | Y | Third multiplier where applicable |
| WPXPrefix | Y | N | prefix as determined by WPX rules |
| GridSquare | Y | Y | 4-character of grid square |
| Run1Run2 | Y | Y | useful when doing SO2R |
| MiscText | Y | N | Contest specific information |
| ContactType | Y | Y | Blank = qso, “D” = dupe, “N” = non-workable or zero-point station (same country in CQWW, for example)” |
| IsRunQSO | Y | Y | To find out how many QSOs were made while running, rather than S&P. |
| Day | Y | Y | first or second day of the contest |
| Mode & Band | Y | Y | – |
| Exchange1 | Y | Y | Use in some contests (like WAE to show QTCs) |
Old contests may not have valid values in fields that have been added since the contact was logged. The number of contacts shown on screen and printed on the summary sheet are without dupe contacts.
File Menu
- Copy All – Copy the contents of the window to the Clipboard, either as text or as a graphic
- Print – Print the statistics table to a printer. Font can be set by user. Also prints graph displays if supported by your printer
- Print to File – Print the statistics table to a file. This function is greyed out when a graph is being displayed.
Example Statistics
Try these examples with an old log:
| Row | Column | Usage | Description |
| Country Prefix | Band | Always | QSOs per country per band |
| Hour | Operator | Multi User | QSOs per hour per operator |
| Band | Operator | Multi User | QSOs per band per operator |
| Grid Square | Band | Grid contests | QSOs per gridsquare per band |
| Band | Exchange1 | WAE and some other | Show RQTC and SQTC info |

